
What We Offer
At Premier Data Insights, we tailor every service to suit your business — whether you're just starting out or scaling up. Our goal is to give you clarity, speed, and confidence in your data.
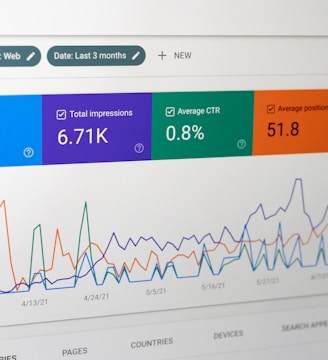
💡 Data Reporting
We design visual reports and dashboards that highlight what matters most. Whether you want daily KPIs or monthly summaries, our reports help you stay on top of your business at a glance.
✅ Fully interactive dashboards
✅ Built in Power BI, Excel, or your platform
✅ Delivered weekly, monthly, or in real time
📈 Predictive Analytics
Don’t just look back — look ahead. We use advanced analytics to forecast future trends and guide your next move.
✅ Identify risks and opportunities
✅ Forecast sales, demand, or customer behavior
✅ Turn data into action plans
🧹 Spreadsheet Cleanup & Automation
Spreadsheets are powerful — but only when they're clean, structured, and working for you. We fix and automate your existing files so they stop holding you back.
✅ Remove errors & duplication
✅ Create smart templates
✅ Automate repetitive tasks (no more manual copy-pasting!)
🌐 Effective Websites - to help your business show up online.
Simple, effective websites for small businesses — built to match your brand and budget.
✅ Fast-loading, mobile-friendly
✅ Contact form, location, and service list included
✅ Ideal for businesses just getting started online
📞 Need something more tailored? Let’s talk about your project
Data Insights
Transforming raw data into actionable insights for small businesses.


Predictive Analytics
Utilizing advanced tools to forecast trends and guide decisions effectively.


Custom Reports
Creating tailored reports that simplify complex data for better understanding.
Premier Data Insights
Transforming data into actionable business solutions today.
info@premierdatainsights.com
+34 642514248
© 2025. All rights reserved.